
MSc Robotics Dissertation
Sim-to-Real Underwater Object Detection
via Physics-Informed Domain Randomisation
Chapter 00
Abstract
Problem
Real underwater labels are scarce and costly. Can synthetic images replace them?
Method
1,000 generated scenes, labelled by SAM 3, degraded by a physics-informed water model.
Result
Eight YOLO26x runs reach up to 11.82% mAP50 on real DUO images, against 98% on synthetic.
Caveat
One seed per run. Regime differences are exploratory associations.
Read the full abstract +
Underwater object detectors are limited less by architecture than by the scarcity and cost of annotated real imagery. This dissertation evaluates target-aware, physics-informed DR for synthetic-to-real UOD under a deliberate constraint: detector weight updates use only synthetic images and SAM 3 pseudo-labels; no real annotations enter fine-tuning. Aggregate target statistics do inform two of the training regimes and earlier real-DUO scores informed the tuned recipe, so the reported figures are a target-informed evaluation, not an estimate from an untouched test set.
A five-stage pipeline generates 1,000 FLUX.2-dev benthic scenes, annotates them zero-shot with SAM 3, estimates relative depth with DAv2, and applies a forward Akkaynak-Treibitz-inspired transform (with a shared direct/backscatter coefficient) as the randomisation mechanism, in uncalibrated, DUO-calibrated and calibrated-plus-scatter regimes. Eight pretrained YOLO26x runs cross four data regimes with two training recipes and are evaluated on a three-class 778-image DUO derivative (Roboflow v2 export).
Under the baseline recipe, uncalibrated degradation was associated with real-domain mAP50 of 2.83% against Base 4.48%, while target-calibrated degradation reached 4.90%; under the tuned recipe the four regimes cluster between 10.31% and 11.82%, with the calibrated-plus-scatter run highest. Synthetic validation stayed at 98.1 - 98.8%, leaving a minimum 86.2% point transfer gap.
Because each cell is a single seed, clean and paired regimes differ in image exposure, and the evaluation partition influenced development, the regime differences are reported as exploratory associations; independent evaluation, matched exposure and repeated seeds are needed before attributing the observed differences to calibration.
Chapter 01
Motivation
Real underwater labels are scarce. Can synthetic images stand in for them?
Aim
The aim of this study is to evaluate the feasibility of target-aware, physics-informed domain randomisation for synthetic-to-real UOD, using synthetically generated training imagery without human-labelled training annotations.
RQ1
Feasibility
What real-domain detection performance can be achieved by a detector trained only on synthetically generated and automatically annotated underwater imagery?
RQ2
Randomisation and calibration
What differences in real-domain detection performance are observed between clean synthetic data, uncalibrated degradation and target-calibrated degradation?
RQ3
Residual limitations
Which observable factors including annotation quality, photometric mismatch, object morphology and object scale appear to limit transfer to the real domain?
Chapter 01 · Motivation
Chapter 02
A first attempt in Unreal Engine
Perfect labels, and almost no detections on real photographs.
Why it stopped
Exact labels.
Optically clean images.
Almost no detections on real photographs. The fix: make the water its own controllable stage.
Engine
UE 5.8
Camera poses
500
Four classes
Coral · Kelp · Rock · Sponge
The full account +
Before the generative pipeline, a geometric route was built in Unreal Engine 5.8 on a licensed underwater asset pack: a benthic scene populated across four classes coral, kelp, rock, sponge a scripted camera path sampled at 500 poses, and per-actor 3D bounding boxes projected through the depth buffer for exact, occlusion-aware ground truth.
A detector trained on that output returned almost no detections on real underwater photographs. The labels were exact, but the imagery was optically clean: the route spent its effort on scene construction while leaving the actual transfer barrier of photometric realism untouched, and the classes it could depict were bounded by the asset pack rather than the benchmark. After seven weeks and two changes of direction over tooling failures, that result motivated the pivot to the generative pipeline, which defers optical appearance to its own controllable, calibratable stage. The simulator arm is retained as the UE Pipeline repository, the record of that pivot.
Chapter 03
The generative pipeline
Generate, label, then add the water.
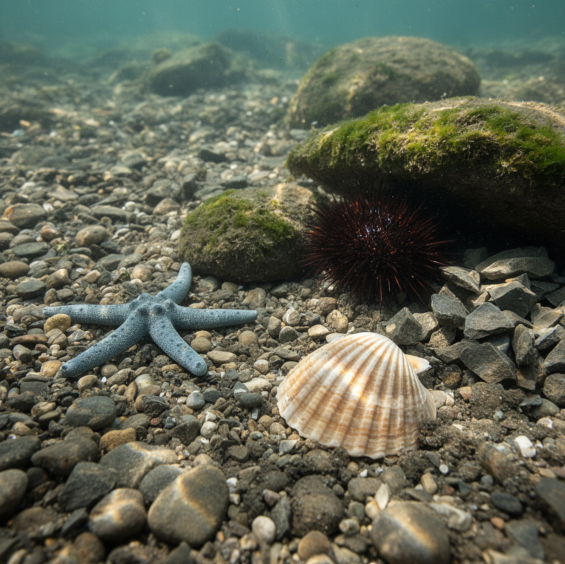
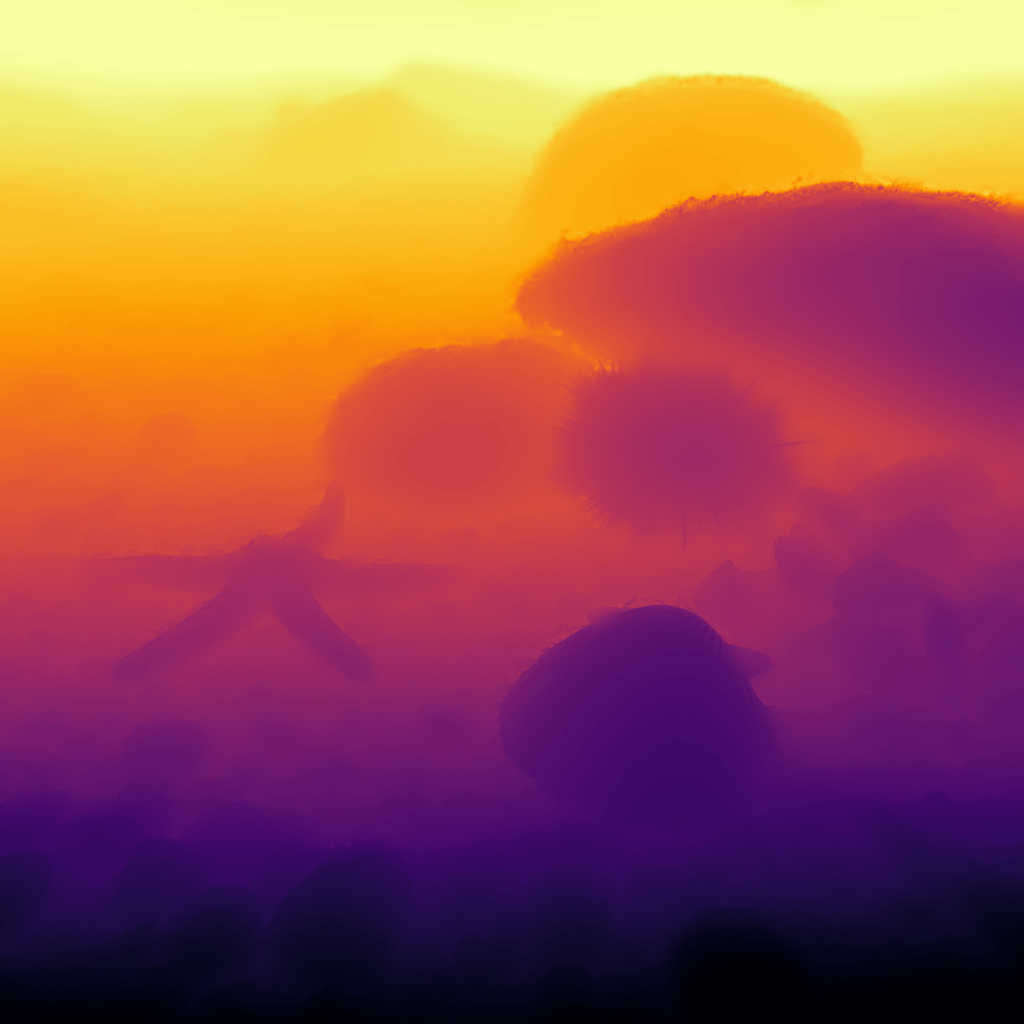
{{ stageCaption }}
-
Chapter 03
The generative pipeline
Generate, label, then add the water.
Stage 01 / 05
Prompt manifest
Each row sets classes, counts, framing and seed for one image. Lighting is colour-neutral; the water is left out on purpose.
-
Stage 02 / 05
Image generation · FLUX.2 dev
Chosen from six tested models: 4.65 against HunyuanImage-3.0's 4.32 on the rubric, at 71 s per image against 284 s.
-
Stage 03 / 05
Zero-shot labels · SAM 3
One presence-gated pass per class. On the same 20 images, Grounding DINO found 4 scallops; SAM 3 found 70.
-
Stage 04 / 05
Relative depth · DAv2 Large
Mapped to a range from 0.3 m outward. It drives how colour loss and haze grow with distance; it is not measured depth.
-
Stage 05 / 05
Physics-informed degradation
An Akkaynak-Treibitz-inspired water model with optical parameters sampled per image. This is the randomisation, and it touches pixels only.
Chapter 03 · Pipeline
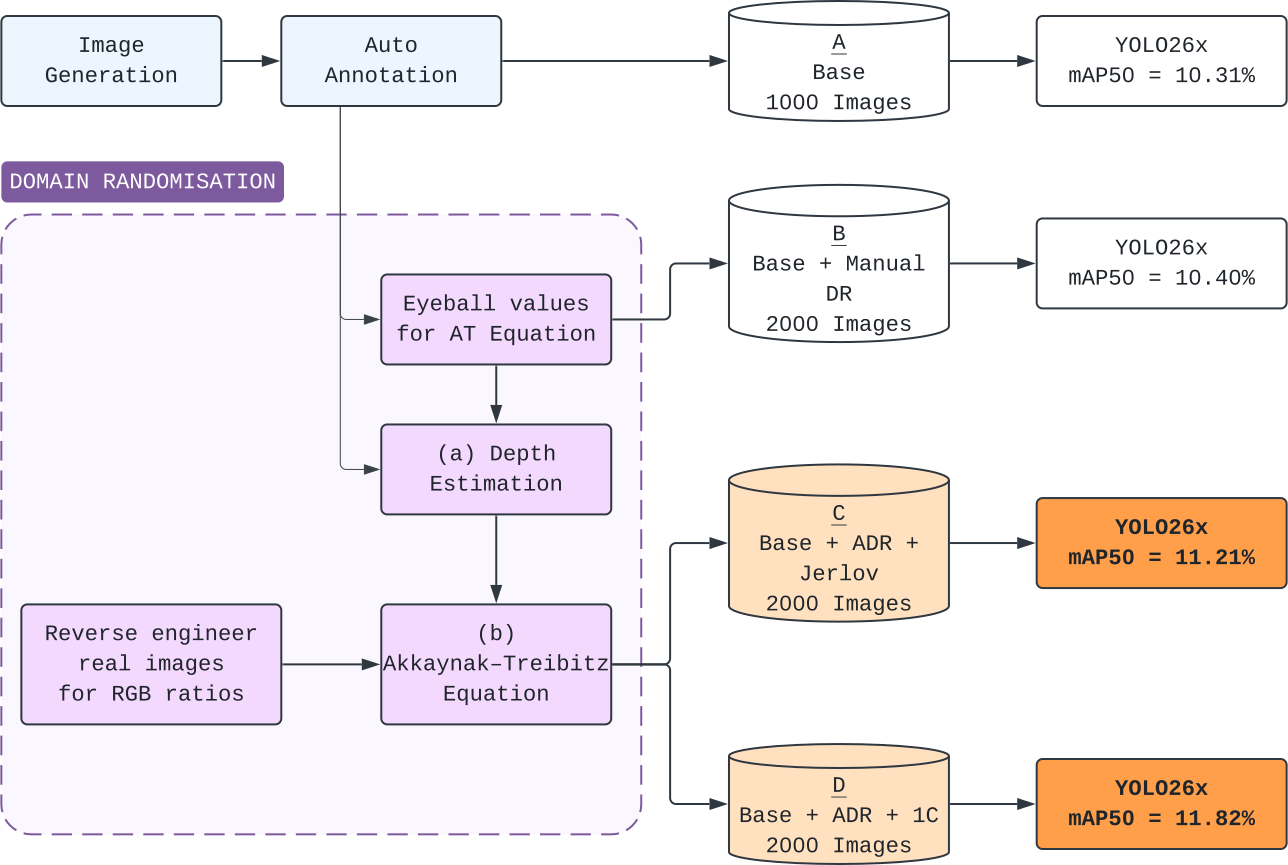
Swipe sideways to see the whole diagram.
Chapter 04
Experimental design
Four kinds of water, two training recipes, eight runs.
{{ r.name }}
{{ r.desc }}
Uncalibrated is "Placeholder" in the dissertation. Degraded regimes train on each clean image plus its degraded copy.
Detector
YOLO26x
COCO-pretrained
Training recipes
Default · Tuned
Every regime trained with both, one seed each
Real test set
778 DUO images
5,914 human-labelled objects · Roboflow v2 export
Classes
Starfish · Scallop · Sea urchin
Chapter 04 · Experimental design
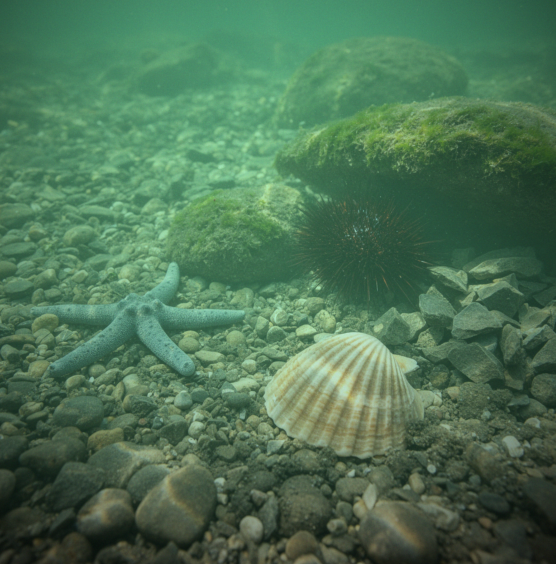
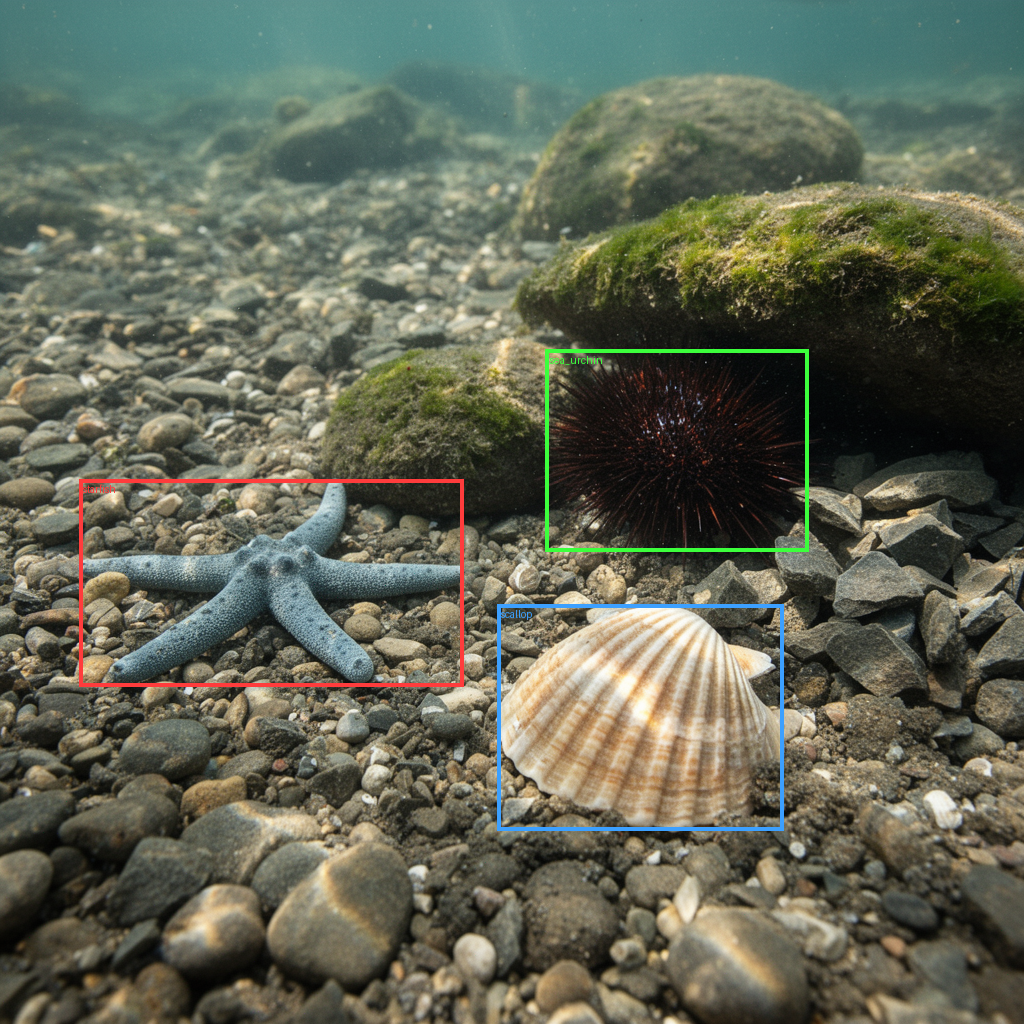
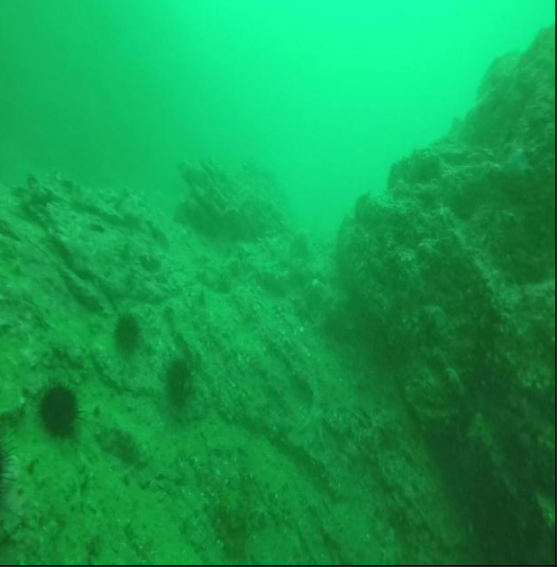
Same frame, different water
Chapter 04 · Experimental design
The class mix inverts between training and test
Each bar splits all labelled objects by class. Scallop is the most common generated class and the rarest real one; sea urchin is three quarters of the real test set.
Generated training images · 4,610 boxes labelled by SAM 3
Real DUO test images · 5,914 boxes labelled by humans
Chapter 05
Results
98% on synthetic images, under 12% on real ones.
Near-perfect on synthetic images, low on real ones
All scores are mAP50: how well the detector finds and boxes each object, from 0% to 100%.
Real DUO test images
Default2.83–4.90%
Synthetic validation
98.1–98.8%
Tuned10.31–11.82%
Chapter 05 · Results
The tuned recipe lifted every regime; calibration changed the order
Each percentage is a run's mAP50 on the 778 real DUO test images: how well it finds and boxes the real objects (100% is perfect).
Chapter 05 · Results
Sea urchin carries the score; starfish is almost never found
{{ g.label }}
{{ g.sub }}
Chapter 05 · Results
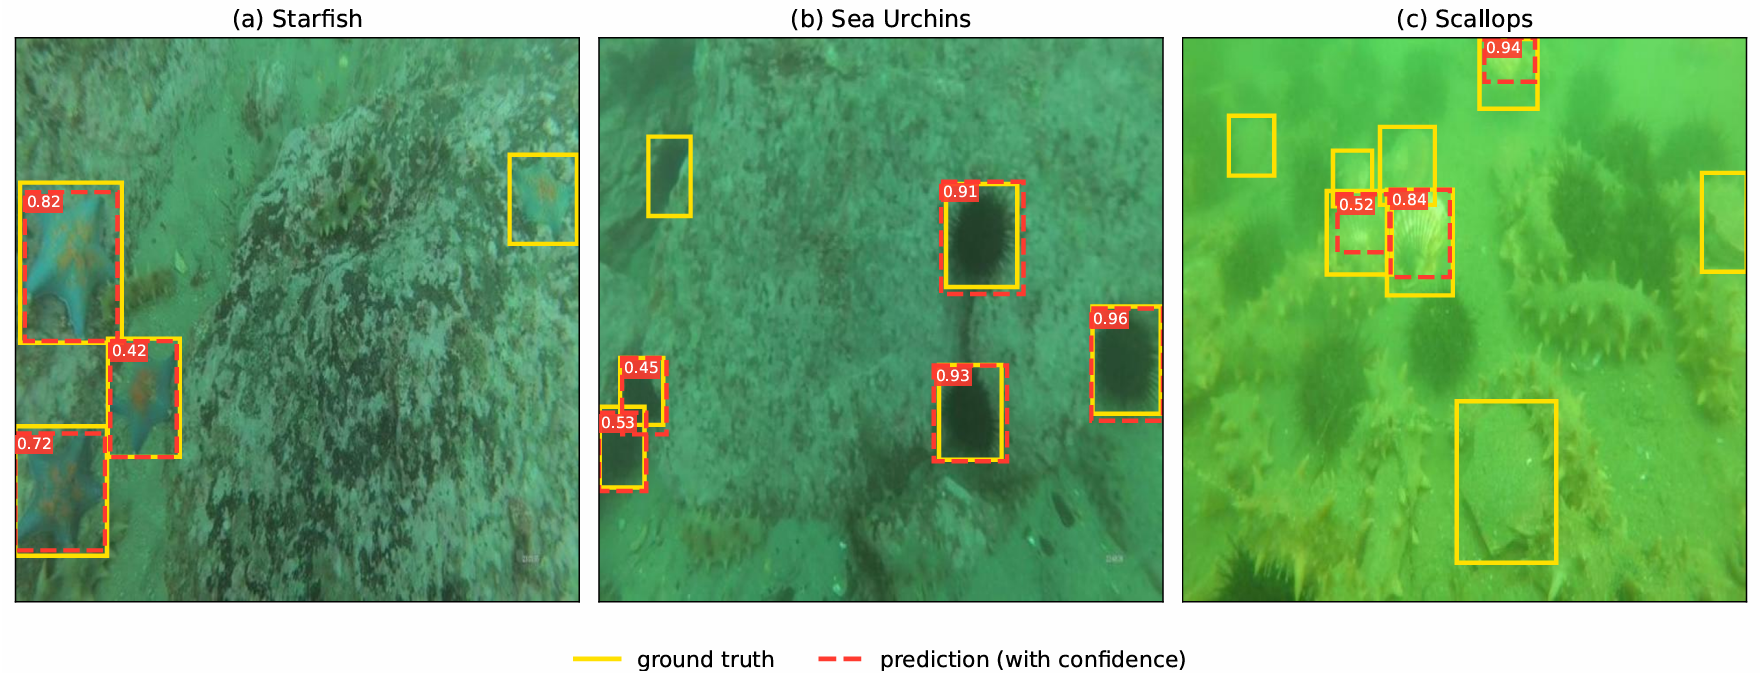
Swipe sideways to see all three panels.
Table 1 · Full metrics for all eight runs +
| Regime | Recipe | mAP50 % | mAP50–95 % | Precision % | Recall % | Gap pp |
|---|---|---|---|---|---|---|
| {{ row.regime }} | {{ row.config }} | {{ row.map50 }} | {{ row.map5095 }} | {{ row.precision }} | {{ row.recall }} | {{ row.gap }} |
Scored on 778 real DUO images. Gap is synthetic-validation mAP50 minus real mAP50. Each cell is one seed-0 run.
Chapter 06
What the measurements answer
With one seed per run, these are observed patterns, not established effects.
RQ1 · Feasibility
11.82%
Transfer is measurable but low
The gap never falls below 86.2 pp, so synthetic validation alone should not pick models here.
RQ2 · Calibration
4.90 vs 2.83%
Where the water is aimed matters more than adding it
Default recipe: calibrated water scored above clean (4.48%), uncalibrated below it.
RQ3 · Limits
≈4×
Several limits overlap; none is isolated
Generated objects are about four times larger in frame than real ones.
Read the full discussion +
RQ1. The nominally highest-scoring run reaches 11.82% mAP50 on the 778-image DUO derivative, while the transfer gap between synthetic and real never falls below 86.2 percentage points. Synthetic validation carried little descriptive information about real transfer in these eight runs and should not be used on its own as a selection criterion here.
RQ2. Under the baseline recipe the four regimes fell on both sides of the clean Base: uncalibrated 2.83%, calibrated 4.90%, Base 4.48%. The same separation is legible on the pixels - calibration moves ratio_rg from 0.944 to 0.705 against a target of 0.438, whereas the uncalibrated regime reaches only 0.790 and moves ratio_bg the wrong way. The reading is exploratory: volume, recipe bundling and single-seed variance all remain confounds.
RQ3. Sea urchin drives the aggregate rise across regimes; starfish is floored below 1.6% in every tuned run; box areas are around 4× oversized against real DUO: 3.6× for starfish, 5.3× for sea urchin, 1.1× for scallop. Photometric mismatch, morphology, scale and the SAM 3 pseudo-label ceiling all remain consistent with the evidence; none is separately measured.
Chapter 06 · Discussion
Generated objects fill more of the frame
{{ z.name }}
{{ z.detail }}
Chapter 07
Limits and further work
What would make these results firmer.
1 seed
Per run, so close results cannot be ranked.
900 vs 1,800
Base is not volume-matched, so Base contrasts mix water with volume.
1 · 1 · 3
One target domain, one detector architecture, three classes.
1
Multiple seeds at matched volume
Repeat all eight runs, and re-run Base at 1,800 images. The cheapest strengthening available.
2
Close the open measurements
A human-reviewed label audit, and recalibration from DUO's disjoint 5,448-image training split.
3
Hybrid geometric–generative pipeline
The engine for scale, framing and placement; the calibrated generative stack for appearance.
4
Broaden external validity
More benchmarks, Jerlov water types and detectors; restore DUO's holothurian class.
Chapter 08
Code and data
Everything needed to rerun the study.
GitHub
Main Pipeline
Generation, SAM 3 annotation, water degradation, training and evaluation.
↗GitHub
UE Pipeline
The Unreal Engine 5 route: scene construction, capture rig and geometric annotation.
↗Hugging Face
Dataset and weights
The 1,000-image FLUX.2 dev v9 corpus, its four regime variants and the eight trained YOLO26x runs.
↗